

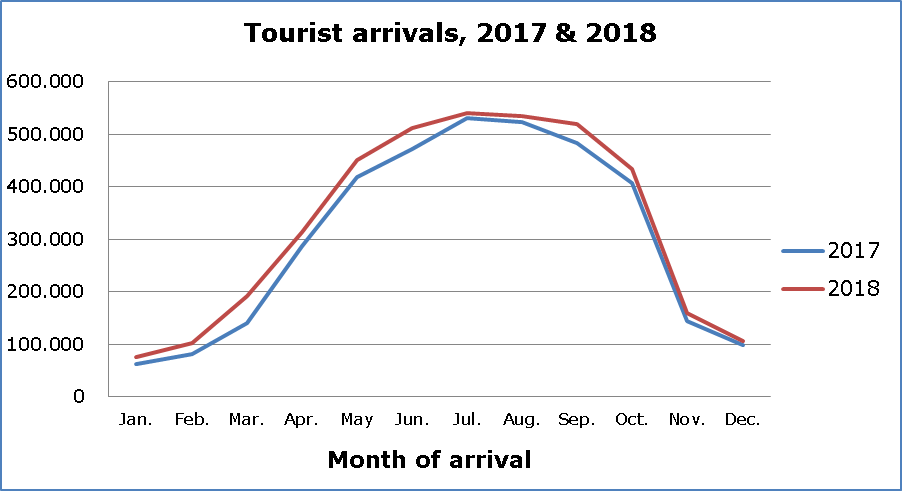
On the basis of the results of the Passengers Survey, arrivals of tourists reached 106,563 in December 2018 compared to 98,924 in December 2017, recording an increase of 7.7%. December 2018 had the highest volume of tourist arrivals ever recorded in Cyprus during the specific month.
For the period of January – December 2018 arrivals of tourists totaled 3.938,625 compared to 3.652,073 in the corresponding period of 2017, recording an increase of 7.8% and outnumbering the total arrivals ever recorded in Cyprus during a year (Table 1).
Analysis of changes
Tourist arrivals from the United Kingdom increased by 13.6% in December 2018 compared to December 2017 while an increase of 13.5% was also recorded for tourists from Greece. Contrary to that, a decrease of 18.8% in tourist arrivals from Russia and 7.2% from Israel were recorded. Percentage changes from one year to the next for the main countries of usual residence of tourists are presented in Table 1.
Main countries
The United Kingdom constitutes the main source of tourism for Cyprus for December 2018, with a proportion of 30.1% while arrivals from Greece comprise 14.8% of total arrivals, from Russia 9.4% and from Israel 8.7% (Table 2).
Purpose of visit
For a percentage of 51.1% of tourists, the purpose of their trip in December 2018 was holidays, for 36.9% visit to friends and relatives and for 11.9% business (Table 3).
| Table1 | ||||||||
|
Country of usual residence |
December |
January – December |
||||||
|
Tourist arrivals |
% change 2018/17 |
Tourist arrivals |
% change 2018/17 |
|||||
|
2016 |
2017 |
2018 |
2016 |
2017 |
2018 |
|||
| TOTAL |
87,927 |
98,924 |
106,563 |
7.7 |
3.186,531 |
3.652,073 |
3.938,625 |
7.8 |
| Austria |
687 |
439 |
988 |
125.1 |
30,419 |
40,473 |
45,888 |
13.4 |
| Belgium |
1,135 |
651 |
616 |
-5.4 |
28,238 |
27,089 |
28,231 |
4.2 |
| France |
1,707 |
886 |
1,843 |
108.0 |
42,576 |
35,931 |
36,500 |
1.6 |
| Germany |
4,413 |
5,100 |
6,096 |
19.5 |
124,030 |
188,826 |
189,200 |
0.2 |
| Denmark |
154 |
180 |
133 |
-26.1 |
29,593 |
34,990 |
43,063 |
23.1 |
| Switzerland (incl. Lichten.) |
468 |
969 |
1,914 |
97.5 |
53,319 |
57,540 |
74,216 |
29.0 |
| Greece |
13,027 |
13,931 |
15,807 |
13.5 |
160,254 |
169,712 |
186,370 |
9.8 |
| United Kingdom |
26,120 |
28,218 |
32,065 |
13.6 |
1.157,978 |
1.253,839 |
1.327,805 |
5.9 |
| Israel |
7,243 |
10,048 |
9,324 |
-7.2 |
148,739 |
261,966 |
232,561 |
-1.2 |
| Lebanon |
1,948 |
1,920 |
1,935 |
0.8 |
50,361 |
58,273 |
62,255 |
6.8 |
| Norway |
496 |
567 |
751 |
32.5 |
47,037 |
54,342 |
55,273 |
1.7 |
| Netherlands |
669 |
498 |
912 |
83.1 |
29,450 |
37,585 |
42,217 |
12.3 |
| Ukraine |
1,417 |
2,004 |
1,839 |
-8.2 |
62,292 |
48,190 |
69,619 |
44.5 |
| Poland |
1,131 |
1,069 |
1,811 |
69.4 |
42,683 |
56,665 |
89,508 |
58.0 |
| Russia |
12,189 |
12,307 |
9,990 |
-18.8 |
781,634 |
824,494 |
783,631 |
-5.0 |
| Sweden |
915 |
827 |
940 |
13.7 |
115,019 |
136,725 |
153,769 |
12.5 |
| Finland |
234 |
49 |
136 |
177.6 |
18,463 |
20,962 |
26,507 |
26.5 |
| Other |
13,974 |
19,261 |
19,463 |
1.0 |
264,446 |
344,471 |
492,012 |
42.8 |
| Table 2 |
|
||||||
| Country of usual
residence of tourists |
Percentage (%) |
||||||
|
Dec 17 |
Jan – Dec 17 |
Dec 18 |
Jan. – Dec 18 |
||||
| United Kingdom |
28.5 |
34.3 |
30.1 |
33.7 |
28.5 |
||
| Greece |
14.1 |
4.6 |
14.8 |
4.7 |
14.1 |
||
| Russia |
12.4 |
22.6 |
9.4 |
19.9 |
12.4 |
||
| Israel |
10.2 |
7.2 |
8.7 |
5.9 |
10.2 |
||
| Germany |
5.2 |
5.2 |
5.7 |
4.8 |
5.2 |
||
| Lebanon |
1.9 |
1.6 |
1.8 |
1.6 |
1.9 |
||
| Switzerland |
1.0 |
1.6 |
1.8 | 1.9 |
1.0 |
||
| Other countries |
26.7 |
22.9 |
27.6 |
27.5 |
|||
| Table 3 | ||||
| Purpose of visit |
Percentage (%) |
|||
|
Dec 16 |
Dec 17 |
Dec 18 |
||
| Holidays |
51.7 |
51.4 |
51.1 |
|
| Visiting friends & relatives |
33.8 |
36.2 |
36.9 |
|
| Business |
14.5 |
12.4 |
11.9 |
|