

The number of households with internet access in Cyprus increased significantly in 2018 compared to 2017. During 2018, 86,2% of households had access to the internet, compared to 79,4% in 2017.
Also, the percentage of households with access to personal computers reached 78,7% in 2018 compared to 75,9% in 2017. An increase was also observed in the percentage of households that own a laptop computer from 65,0% in 2017 to 68,5% in 2018.
The percentage of households with dependent children that own a computer reached 93.3% in 2018.
Use of Internet
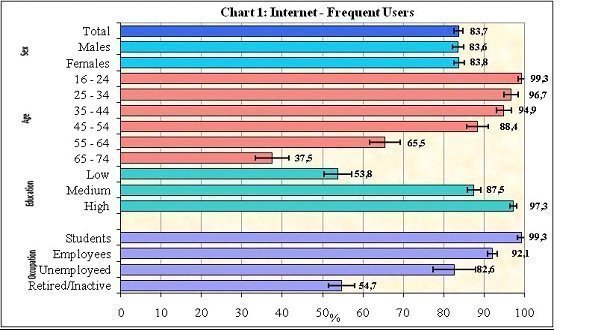
83,7% of persons aged 16-74 are using the internet at least once a week. Almost all persons aged 16 – 24 years old (99,3%) use the internet at least once a week. This percentage decreases with age, even though for individuals 65 – 74 years old the use of internet increased to 37,5% in 2018 compared to 33,9% in 2017. High educated persons (97,3%) use the internet more frequently than persons with lower education level (53,8%).
During the first quarter of 2018, internet usage increased to 84,4% compared to 80,7% in 2017.
The most popular Internet activities are the following: finding information about goods and services (85,1%), participating in social networks (81.7%), watching video content from sharing services (80,8%), telephoning over the internet/video calls (via webcam) over the internet (74,4%) and seeking health-related information (67,1%).
87,5% of the persons that used the Internet in the first quarter of 2018, used their mobile phone or smart phone to access the Internet away from home or work while, 16,7% used a laptop and 11.5% used a tablet.
e-Commerce
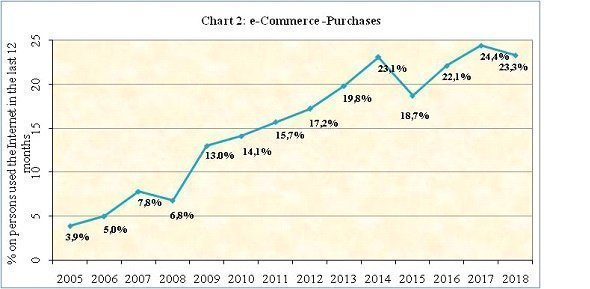
23,3% of persons aged 16 – 74 years old made online orders for goods and services in the first quarter of 2018 compared to 24,4% in 2017.
The most popular categories of goods/services ordered online were the following: clothes or sports goods (56,3%), other travel arrangements such as transport tickets, car hire etc. (51,3%) and holiday accommodation (46,7%).
During the period April 2017-March 2018, 82,9% of persons aged 16-74 that bought or ordered goods and services for private use prefer sellers from other EU countries, 35,8% prefer sellers from the rest of the world and 34,6% buy or order from sellers in Cyprus. The amount spent for goods or services over the internet was usually between 100-500 Euros.
| Table 1 | ||||
| Computer in Household (% of Households) |
2015 |
2016 |
2017 |
2018 |
| Personal Computer |
71,0 |
71,5 |
75,9 |
78,7 |
| By computer type: | ||||
| Desktop computer |
31.4 |
20.5 |
20.3 |
20.1 |
| Laptop |
62,7 |
62,6 |
65,0 |
68,5 |
| Tablet |
39,2 |
40,3 |
45,9 |
44,2 |
| By household type: | ||||
| With dependent children |
93.1 |
93.7 |
94.9 |
93.3 |
| Without dependent children |
62.1 |
63.0 |
68.5 |
72.0 |
| Households with Internet access |
71.2 |
74.4 |
79.4 |
86.2 |
| Table2 | ||||
| Internet Use |
2015 |
2016 |
2017 |
2018 |
| % individuals that used the internet (1st quarter of the year) |
71,7 |
75,9 |
80,7 |
84,4 |
| Most popular Internet Activities | ||||
| Finding information about goods and services |
74,8 |
81,1 |
76,1 |
85,1 |
| Participation in Social Networks |
75,4 |
79,0 |
78,1 |
81,7 |
| Watching video content from sharing services (e.g.YouTube) |
… |
… |
… |
80,8 |
| Telephoning over the internet/video calls (via webcam) over the internet |
62,3 |
71,8 |
70,0 |
74,4 |
| Seeking health-related information |
69,5 |
56,3 |
71,8 |
67,1 |