

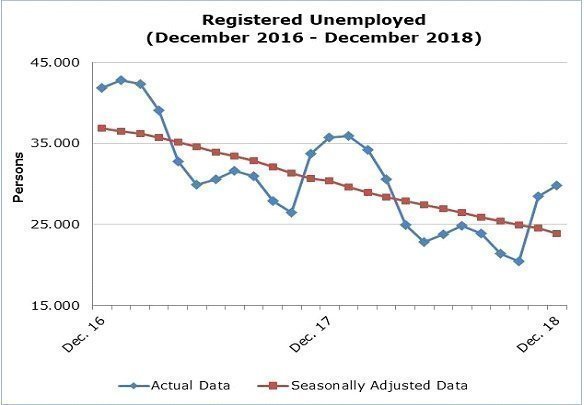
The unemployed persons, registered at the District Labour Offices on the last day of December 2018, reached 29,800 persons. Based on the seasonally adjusted data that show the trend of unemployment, the number of registered unemployed for December 2018 decreased to 23,929 persons in comparison to 24,589 in the previous month.
In comparison with December 2017, a decrease of 5,971 persons or 16.7% was recorded which was mainly observed in the sectors of trade (a decrease of 1,193 unemployed persons), public administration (a decrease of 1,137), accommodation and food service activities (a decrease of 794), manufacturing (a decrease of 607), construction (a decrease of 529), education (a decrease of 189) and to newcomers in the labour market (a decrease of 1,521).
| Table 1 | ||
|
Month and Year |
Registered Unemployed – Actual Data |
Registered Unemployed – Seasonally Adjusted Data |
| 2018 |
|
|
| December |
29,800 |
23,929 |
| November |
28,514 |
24,589 |
| October |
20,447 |
24,958 |
| September |
21,399 |
25,462 |
| August |
23,866 |
25,872 |
| July |
24,803 |
26,433 |
| June |
23,808 |
26,993 |
| May |
22,839 |
27,478 |
| April |
24,903 |
27,897 |
| March |
30,616 |
28,395 |
| February |
34,204 |
28,962 |
| January |
35,989 |
29,670 |
| 2017 |
|
|
| December |
35,771 |
30,393 |
| November |
33,780 |
30,679 |
| October |
26,436 |
31,317 |
| September |
27,951 |
32,105 |
| August |
31,003 |
32,917 |
| July |
31,670 |
33,467 |
| June |
30,577 |
33,913 |
| May |
29,922 |
34,583 |
| April |
32,804 |
35,192 |
| March |
39,088 |
35,796 |
| February |
42,326 |
36,225 |
| January |
42,839 |
36,564 |
| 2016 |
|
|
| December |
41,852 |
36,932 |
| Table 2 | ||||
|
NaceRev.2 |
Economic Activity |
Registered Unemployed (actual data) |
||
|
December 2017 |
November 2018 |
December 2018 |
||
|
A |
Agriculture, Forestry and Fishing |
202 |
160 |
146 |
|
B |
Mining and Quarring |
39 |
45 |
50 |
|
C |
Manufacturing |
2,231 |
1,679 |
1,624 |
|
D |
Electricity, Gas, Steam and Air Conditioning Supply |
14 |
11 |
11 |
|
E |
Water Supply, Sewerage, Waste Management and Remediation Activities |
92 |
95 |
95 |
|
F |
Construction |
2,295 |
1,.813 |
1,766 |
|
G |
Wholesale and Retail Trade, Repair of Motor Vehicles and Motorcycles |
5,808 |
4,748 |
4,615 |
|
H |
Transportation and Storage |
1.404 |
1.325 |
1.448 |
|
I |
Accommodation and Food Service Activities |
10,372 |
8,623 |
9,578 |
|
J |
Information and Communication |
518 |
430 |
460 |
|
K |
Financial and Insurance Activities |
881 |
1,420 |
1,398 |
|
L |
Real Estate Activities |
245 |
246 |
235 |
|
M |
Professional, Scientific and Technical Activities |
1,137 |
1,033 |
990 |
|
N |
Administrative and Support Service Activities |
1,083 |
1,044 |
1,107 |
|
O |
Public Administration and Defence, Compulsory Social Security |
3,232 |
1,389 |
2,095 |
|
P |
Education |
739 |
572 |
550 |
|
Q |
Human Health and Social Work Activities |
455 |
389 |
376 |
|
R |
Arts, Entertainment and Recreation |
607 |
518 |
528 |
|
S |
Other Service Activities |
656 |
506 |
526 |
|
T |
Activities of Households |
95 |
55 |
49 |
|
U |
Activities of Extra-territorial Organizations and Bodies |
20 |
29 |
28 |
|
|
Newcomers |
3,646 |
2,384 |
2,125 |
|
|
Total |
35,771 |
28,514 |
29,800 |
Methodological notes
Definitions
Registered Unemployed
The number of registered unemployed concerns the persons aged 15 years and over who apply at the District and Local Labour Offices of the Department of Labour to seek employment and are registered as unemployed. These persons have to be able and available for work and must be actively looking for one. The monthly number of registered unemployed concerns the persons who during the last day of the month have an active application for seeking employment.
The number of registered unemployed does not included self-employed or persons who seek part-time employment as well as persons who seek employment in certain areas or for a specific employer.